
Weather in Calais
Forecast, climate by month and wind on the coast
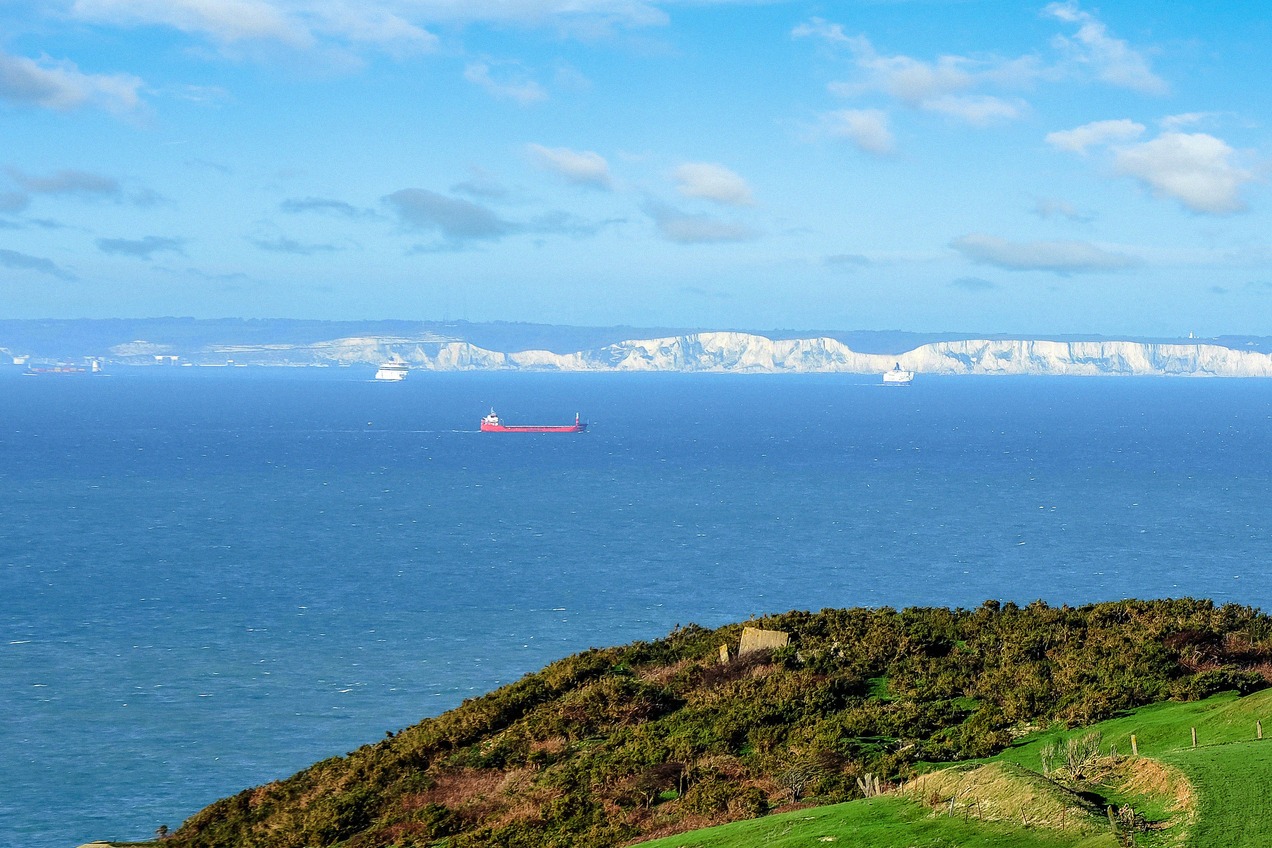
Calais lies on the coast, about 30 km across the water from Dover. Winters are mild and windy, and in July and August afternoons average around 22 °C. The forecast for the next few days and the monthly averages show what to expect on the beach and for your crossing.
Forecast for Calais
Loading the forecast…
On this page
The climate in Calais
The forecast for the next few days is at the top of this page. For planning a trip, the long-term averages for the years 1991 to 2020 are more useful. They show mild winters, moderate summers, rain in every month and a lot of wind, above all in winter.
The average annual temperature is 11.0 °C, with afternoons averaging 14.5 °C and nights 7.6 °C. Annual rainfall is 737.1 mm, and at least 1 mm of rain falls on 120.5 days a year. January is the coolest month with a mean of 5.1 °C, August the warmest with 17.9 °C.
Month by month
The table shows the average daytime high, the mean temperature across day and night, the average low and the rainfall for each month.
Hot days are rare. On average, 14.8 days a year reach 25 °C, most of them in July and August, and 2.1 days reach 30 °C. The temperature falls to 0 °C or below on 31.4 nights a year, most often in January with 8.4 nights, but only 2.7 days a year stay at or below 0 °C all day.
The highest temperature recorded since 1991 is 39.9 °C, on 19 July 2022. The lowest is −14 °C, on 8 January 2010.
Rain and sunshine
Most of the rain falls in autumn and early winter. October, November and December each bring more than 80 mm, and November is the wettest month at 92.4 mm, with at least 1 mm of rain on 13.1 days. April is the driest month at 37.9 mm, followed by March at 40.2 mm. In summer, rain falls on 8 to 9 days a month. The heaviest rain in a single day since 1991 was 79.8 mm, on 23 September 2022.
From April to August the sun shines for more than 200 hours a month on average, most in July with 239.3 hours. In December it is 63.1 hours. These sunshine figures cover the years 2011 to 2020.
Wind
The wind is strongest from autumn to early spring. In December there are on average 11.4 days with gusts of 58 km/h or more, in February 10.6 and in November 9.2. From June to August there are 4.5 to 4.9 such days a month.
On the seafront, the wind decides what you can do:
- Dragon: the dragon on the seafront depends on the weather, and rides can be cancelled, for example during an orange wind warning.
- Lighthouse: at the lighthouse, the guides interrupt or stop the climb in strong wind, storms and thunderstorms.
- Kitesurfing and windsurfing: Sangatte, west of Calais, is a spot for both, as described under Blériot-Plage and Sangatte.
When to go
Which months suit you depends on what you have in mind:
- Beach and swimming: July and August are the warmest months. The town beach has a supervised bathing zone, and in 2026 the official bathing season ran from 13 June to 13 September. The flags and the water quality are explained under swimming. In clear weather you can see the English cliffs from the beach.
- Big tides: spring and autumn bring the big tides to the Opal Coast. The beach changes with the tides, so look at the tide forecast for Calais as well as the weather.
- Walks and day trips: May, June and September have highs of 16.6 to 19.5 °C and much less rain than October and November. The capes and the coastal walks are covered under Opal Coast and day trips.
- Winter: from December to February, highs average 7.6 to 8.2 °C. In winter, Calais has a Christmas market.
Wind and crossings
From Calais, DFDS, P&O Ferries and Irish Ferries sail to Dover, and LeShuttle runs through the Channel Tunnel to Folkestone in 35 minutes. In bad weather, ferry sailings can be delayed or cancelled. Current sailing updates are on the ferry companies' websites, and LeShuttle shows its departures live on its website.
Routes, the terminal and check-in are explained under ferries and Eurotunnel LeShuttle. For a night close to the port before an early sailing, see before the ferry.
Frequently asked questions
What is the warmest month in Calais? +
When does it rain most in Calais? +
Can you swim in Calais? +
Is Calais windy? +
How cold does it get in winter? +
Weather forecast: Meteonomiqs.